![BuyerBridge_LOGO-dark-2.png]](https://support.buyerbridge.com/hs-fs/hubfs/BuyerBridge_LOGO-dark-2.png?height=40&name=BuyerBridge_LOGO-dark-2.png)
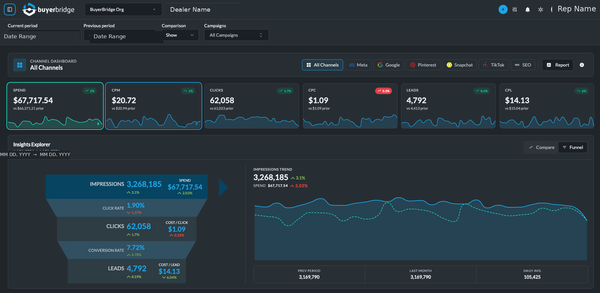
The BuyerBridge dashboard gives you a real-time view of a client's performance. By default it shows All Channels together, and you can filter to any single channel in one click. That means you can look at the full cross-channel picture or zoom into Meta, Google, or any other channel, without building a report.
📊 Dashboard insights are powered by your connected channel and analytics integrations.
How to Find the Dashboard in BuyerBridge
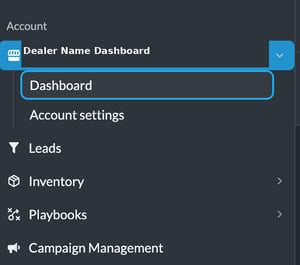
- Log in to BuyerBridge and open the client's Dashboard.
- The dashboard opens on All Channels by default.
- To focus on one channel, use the channel buttons at the top (All Channels, Meta, Google, Pinterest, Snapchat, TikTok, SEO).
Click any channel to filter the whole dashboard to it, or All Channels to return to the combined view.
Where the Dashboard Data Comes From
BuyerBridge pulls dashboard insights from the integrations connected for each channel. For example:
- Ad channels (Meta, Google, TikTok, Snapchat, Pinterest): spend, impressions, clicks, and conversions from each platform
- Google: also blends in GA4 and Google Search Console
- SEO: organic search performance
If a section looks blank, check that the correct accounts are connected for that channel.
What You Can See on the Dashboard
KPI Tiles
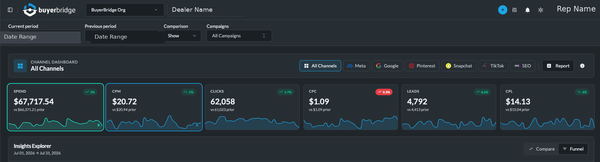
Across the top, quick totals give you the numbers you reach for most: Spend, CPM, Clicks, CPC, Leads, and CPL, each with a small trend line. These are built for standups and fast recaps. You can also select tiles to feature them in the Insights Explorer comparison below.
Insights Explorer
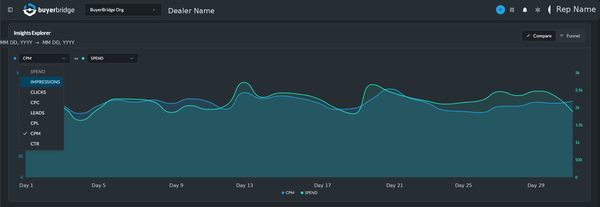
The Insights Explorer is the heart of the dashboard, with two modes you toggle in the corner: Funnel and Compare.
Funnel shows a full-funnel snapshot in one view, so you can quickly answer, "are we getting attention, traffic, and outcomes for the spend?" It steps through:
- Impressions
- Click rate, then Clicks
- Conversion rate, then Leads
- With Spend, Cost per Click, and Cost per Lead alongside
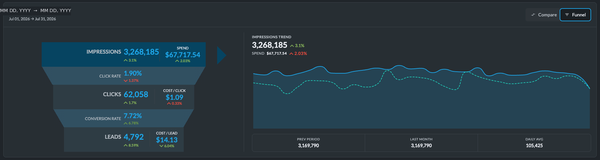
Next to the funnel, a trend chart tracks your selected metric across the date range, so sudden drops, spikes, and slow declines are easy to spot. Below it, benchmark tiles answer "what changed?" at a glance: Previous Period, Last Month, and Daily Average.
Compare lets you put two metrics side by side (like Clicks vs Spend) to catch patterns faster, such as spend rising while clicks stay flat, or clicks rising while leads drop.
Spend Pacing
See where spend is projected to land for the period versus the previous month, with an at-a-glance on pace indicator. It shows how much has been spent so far, the projected end-of-month total, the average daily spend, last month's spend, and the change versus last month. Use it to catch pacing problems before month-end.

Day-of-Week Performance
Performance aggregated by weekday, with a toggle for Impressions, Spend, Clicks, or Leads. It highlights which day drives the most and least of the selected metric, so you can time budget and messaging around when demand actually shows up.

Campaigns
Below the charts, the Campaigns section lists the client's campaigns for the selected period and channel, with per-campaign spend, impressions, clicks, leads, and cost metrics, plus quick access to Preview Ads. On the All Channels view, campaigns are grouped by channel.
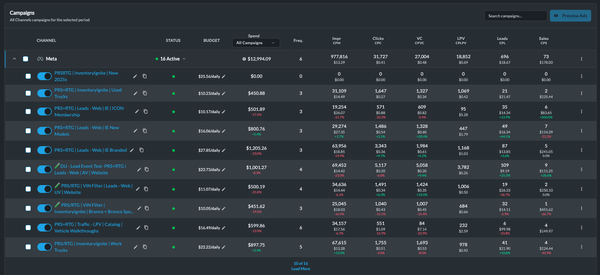
💡 Note: Some columns apply only to certain channels (for example, video-view and landing-page-view metrics), so you may see "N/A" where a metric does not apply to that channel's campaign type.
For managing campaigns from here, adjusting budgets, toggling status, and previewing ads, see Unpacking Campaign Management.
Quick Tips for Fast Teams
- Start on All Channels for the full picture, then filter to a channel to dig in.
- Use the Funnel to see where performance is breaking.
- Switch the trend metric to Leads when a client asks, "are we still generating?"
- Check Spend Pacing before month-end so nothing over- or under-spends.
- Use the Previous Period and Last Month tiles before sending updates, so you can explain changes clearly.
- Use Compare when you suspect a pacing or efficiency problem.
Continue Learning
- Related: Unpacking Campaign Management