![BuyerBridge_LOGO-dark-2.png]](https://support.buyerbridge.com/hs-fs/hubfs/BuyerBridge_LOGO-dark-2.png?height=40&name=BuyerBridge_LOGO-dark-2.png)
Quick Links
- Overview
- Getting started
- Report & page settings
- Adding and arranging widgets
- The widget inspector
- Widget types
- Presenting and exporting reports
- Tips and troubleshooting
1. Overview
The new Report Builder 2.0 is a drag-and-drop tool for creating fully custom, client-ready performance reports inside BuyerBridge. You build a report by dropping widgets, charts, scorecards, tables, funnels, and more, onto a page, then configuring each one to show exactly the data and styling you want.
Because it's a builder, there is no single "correct" report. Everything you see in a template is just a starting point. This article explains how to set up the building blocks so you can assemble whatever your client or agency needs.
This said, we’ve created a few starter templates for you to use in the BuyerBridge platform:
- Default - Ad spend shown
- Digital Advertising Report
- Digital Advertising Report & Comparisons
- No ad spend shown (use this if you have a % of media spend pricing model)
- Digital Advertising | Metrics
- Digital Advertising | Metrics & Comparisons
What's different from the classic builder
The new Report Builder replaces the older reporting tool with a more flexible, widget-based canvas modeled on other similar reporting tools. Compared to the classic builder, it adds a larger library of advanced widgets, drag-and-drop placement with easy metric reordering, deeper per-widget styling, and the ability to report across multiple channels in one report. The reports you build can be saved, scheduled, and exported just as before.
Reporting across every connected channel
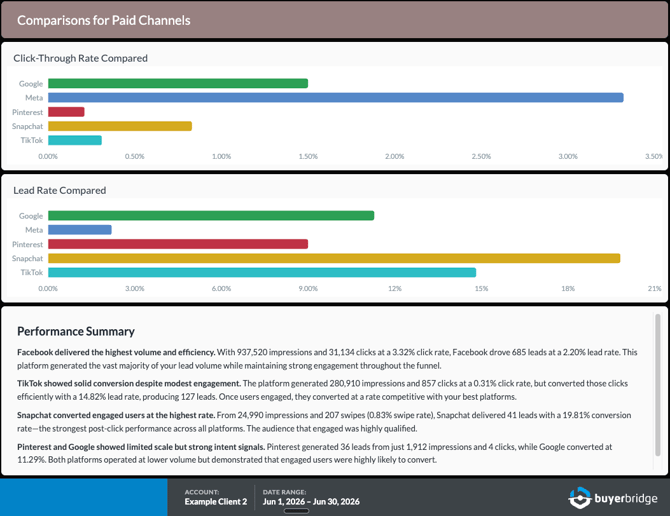
Every widget can pull from any channel your account is connected to in BuyerBridge, Meta, Google, TikTok, Snapchat, Pinterest, and Reddit, as well as cross-source totals that combine them. A single report (and even a single page) can blend results from multiple channels side by side. Plan your report around the story you want to tell, and pull each widget's data from whichever channel(s) support it.
Reports are now “channel-aware”
One of the most powerful things about the Report Builder is that reports adapt to each client's connected channels automatically. You build one comprehensive template, and the report tailors itself per account.
When a report is generated or presented for a specific client, BuyerBridge prunes anything that doesn't apply to that client's connected channels:
- Channel-only pages are removed. If a client isn't on Pinterest, a page that only shows Pinterest metrics is dropped.
- Missing sources are removed from multi-source widgets. In a chart that combines several channels, the unavailable channel's data is stripped out so the widget still makes sense.
What this means for you: build your template once with every channel included. You don't need a separate version per client; each report automatically reflects exactly what that client runs.
2. Getting started
Opening the Report Builder
In the left side navigation, go to “Reports > Report Builder.”
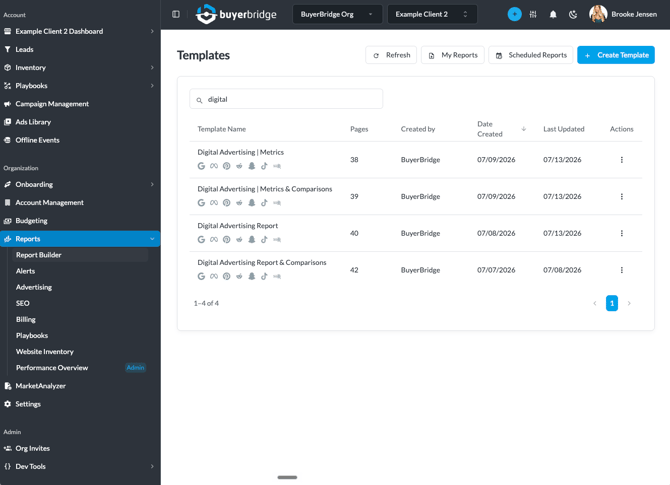
Reports live on the Templates screen. Each row is a saved report template, showing its name, the connected channel icons, page count, who created it, and create/update dates.
From here you can:
- Create Template - start a new report in the Report Builder.
- Edit an existing template - open it in the builder (via the row's ).
- Duplicate a template - copy an existing report as your starting point. Duplicating one of BuyerBridge's pre-built templates is the fastest way to begin, because the pages and widgets are already laid out; you just swap in the account, adjust metrics, and restyle to match your branding.
- Generate Report / Scheduled Reports - produce or schedule a PDF (see Section 8).
- Search templates by name - find a report quickly.
The workspace at a glance
The builder has three main areas:
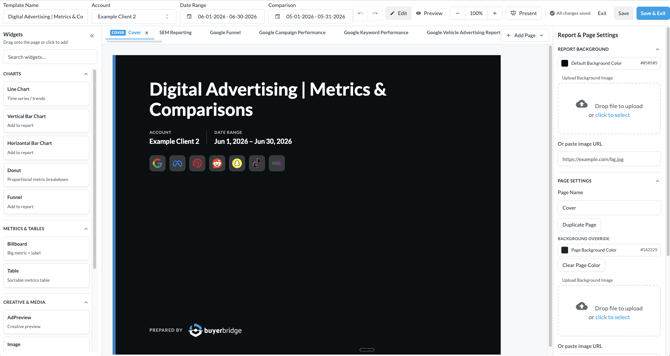
- Top bar - report-level controls and mode switches, like date ranges, that apply to the whole report.
- Widget library (left) - the catalog of widgets you can add to a page. Collapse it with the « button to free up canvas space, and expand it again when you need it.
- Settings panel (right) - a contextual panel that changes depending on what you have selected (explained below).
The top bar
The top bar holds the settings and controls that apply to the whole report:
- Template Name - the name of the report.
- Account - the client/account the report pulls data for.
- Date Range - the reporting period for the whole report.
- Comparison - an optional second date range. When set, widgets can show period-over-period change.
- Undo / Redo - step backward or forward through your edits. On Mac, undoes and redoes.
- Edit / Preview toggle - switch between Edit mode (build and configure) and Preview mode (see the report as a viewer would, with channel CTAs shown; see Section 7).
- Zoom the canvas - in or out; the current zoom level (e.g., 100%) is shown between the buttons.
- Present - launch the full-screen, animated presentation experience for client calls (see Section 8).
- Saved-status indicator - shows whether your work is saved (e.g., "All changes saved").
- Exit / Save - leave the builder, or save your progress.

Pages
A report is organized into pages, shown as tabs along the top (for example: Cover, then one page per channel or theme). Click a tab to move between pages.
Use Add Page to create a new page. The button has a dropdown so you can choose a page type, for example a Blank Page, and (if the report doesn't yet have one) a front or back cover. Each page is its own canvas of widgets and can have its own background settings (see below).
Contextual Settings Panel (important)
The panel on the right has two modes, and which one you see depends on what's selected:
- Report & Page Settings - shown when no widget is selected (you've clicked an empty area or a page tab). Controls the look of the report and pages. See Section 3.
- Widget Inspector - shown when you click a widget. Controls that specific widget's data, metrics, and styling. See Section 5.
Knowing which mode you're in is the key to using the builder: click empty space to style the report, or click a widget to configure that widget. To get back to Report & Page Settings from a selected widget, press Escape or click Back to page settings.
3. Report & Page Settings
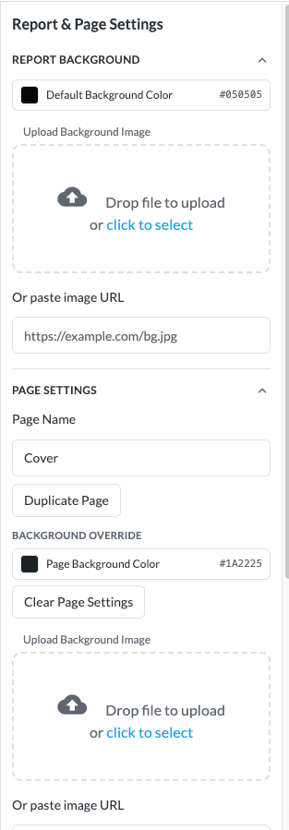
When no widget is selected, the right panel shows Report & Page Settings, the controls that style the overall report and individual pages.
Report Background
Sets the default background for every page in the report.
- Default Background Color - pick the report-wide background color (hex value shown).
- Upload Background Image - drop a file or click to select an image to use as the background.
- Or paste image URL - link to a hosted image instead of uploading.
Page Settings
Controls the currently selected page.
- Page Name - rename the page (this is the label on the page tab).
- Duplicate Page - copy the entire page, including its widgets, useful for repeating a layout across channels.
- Background Override - give this one page a different background than the report default:
- Page Background Color - overrides the report color for this page.
- Clear Page Color - removes the override so the page inherits the report default again.
- Upload Background Image / paste image URL - page-specific background image. Leave set to Inherit from report to use the report default.
Cover Page Settings
Shown for the cover page. Styles the title block and platform icons on the report's cover.
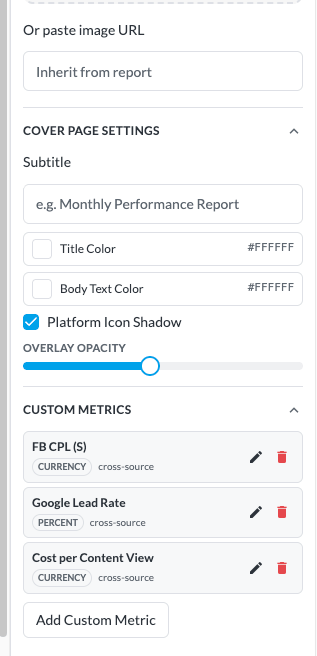
- Subtitle - a subtitle under the report title (e.g., "Monthly Performance Report").
- Title Color / Body Text Color - colors for the cover's title and body text.
- Platform Icon Shadow - toggles a drop shadow behind the channel icons on the cover.
- Overlay Opacity - controls how dark/light the overlay sits over a background image so text stays readable.
Grid Settings
Controls how tightly widgets snap to the page grid.
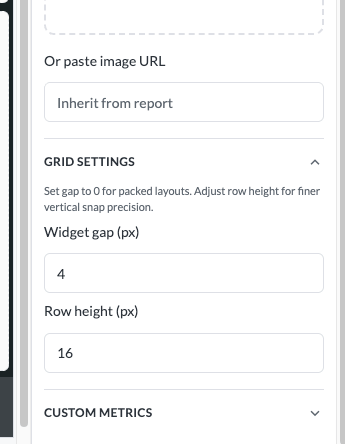
- Widget gap (px) - spacing between widgets. Set to 0 for packed, edge-to-edge layouts.
- Row height (px) - the vertical snap increment. Smaller values give finer control over widget height and placement.
Custom Metrics
Define your own calculated metrics that can then be selected inside any widget. Custom metrics can combine data across sources (note the cross-source tag), which is how you build blended KPIs like a combined cost-per-lead across channels.
- Each custom metric shows its name, format (Currency, Percent, etc.), and source scope.
- Use the edit (✏️) and delete (🗑️) icons to manage existing metrics.
- Add Custom Metric - create a new one.
4. Adding and arranging widgets
Open the widget library on the left. You can:
- Drag a widget from the library onto the page, or
- Click a widget to add it to the page.
Widget Types
Below is the standard widget library. Add any of these from the left panel, then configure it using the Inspector pattern in Section 5. Use this as a reference for what each widget is best at; the example template uses many of them, but you can build any of them for any channel.
Charts
| Widget | Best for |
|---|---|
| Line Chart | Time-series and trends - a metric (or two) plotted over the date range. |
| Vertical Bar Chart | Comparing a metric across categories (e.g., spend by vehicle or campaign). |
| Horizontal Bar Chart | Same as vertical, better when category labels are long. |
| Donut | Proportional breakdown - share of a metric across segments. |
| Funnel |
Metrics & Tables
| Widget | Best for |
|---|---|
| Billboard | A single big number with a label - your headline KPIs (e.g., Total Leads, Cost Per Lead). |
| Table | A sortable, multi-column grid of metrics across rows (e.g., campaigns or vehicles). |
Creative & Media
| Widget | Best for |
|---|---|
| AdPreview | Show a live creative preview of an ad inside the report. |
| Image | Upload or link an image (logos, dividers, custom graphics). |
| CustomerResource | A customer-facing link paired with an image. |
Content
| Widget | Best for |
|---|---|
| TextBox | Rich-text commentary and headings to annotate the report. |
| AiInsights | AI-generated written insights about the widget/section's data. |
Use Search widgets… at the top of the library to find a widget by name.
The BuyerBridge Team’s favorite new widgets? “Ad Previews” and “AI Insights!” Perfect for dynamic reports and eliminates manual work of typing in high-level takeaways and sending one-off ad preview links every month for top performers.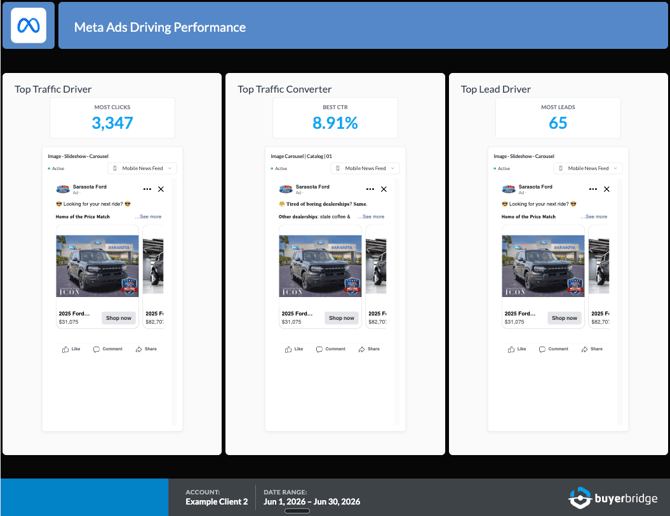
Moving and resizing
- Move - drag a placed widget to reposition it. Widgets snap to the grid as you move them, so things stay aligned (grid spacing is set in Grid Settings).
- Resize - drag a widget's edges/corners to change its size; it snaps to the grid here too.
- Reorder metrics within a widget - you don't drag these on the canvas; you reorder them in the Widget Inspector (see next section).
Duplicating and removing
- Duplicate - when a widget is selected, a small duplicate button appears in its top-right corner for a quick copy. You can also duplicate from the bottom of its Widget Inspector (Duplicate widget).
- Remove - use the in the selected widget's top-right corner, or Remove widget at the bottom of its Inspector.
Undo and redo
Made a change you didn't mean to? Use the Undo / Redo buttons in the top bar, or the keyboard shortcuts (undo) and (redo) on Mac.
5. The Widget Inspector
Click any widget to open the Widget Inspector on the right. While the exact sections vary slightly by widget type, almost every widget follows the same pattern, top to bottom. Learn this pattern once and you can configure any widget.
To leave the Inspector and return to Report & Page Settings, press Escape or click Back to page settings.
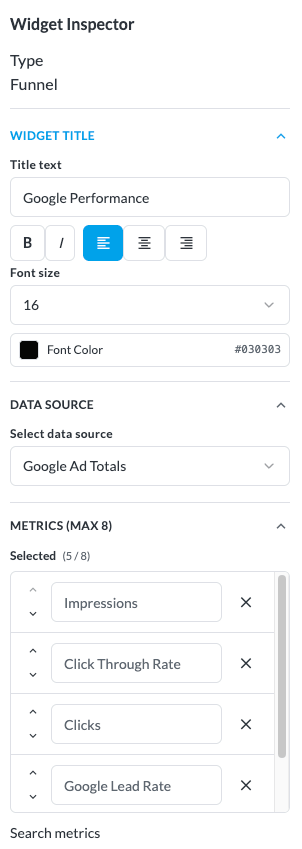
At the very top, the Inspector shows the widget type you're editing (e.g., Funnel, Table, Billboard). This is set when you add the widget from the library.
Widget Title
Controls the widget's heading.
- Title text - the heading shown on the widget.
- Bold / Italic and alignment (left/center/right).
- Font size and Font Color.
Typography (some widgets)
Some widgets (such as the Table) add a Typography section to control the styling of the widget's body text, separate from the title above. Expand it to adjust how the data inside the widget is rendered.
Data Source
The single most important setting. Select data source chooses which channel or dataset the widget pulls from, for example Google Ad Totals, a specific channel, or a cross-source total. Changing the data source changes which metrics are available below.
This is where cross-channel reporting happens: set one widget to Google, another to Meta, another to a combined total, all on the same page.
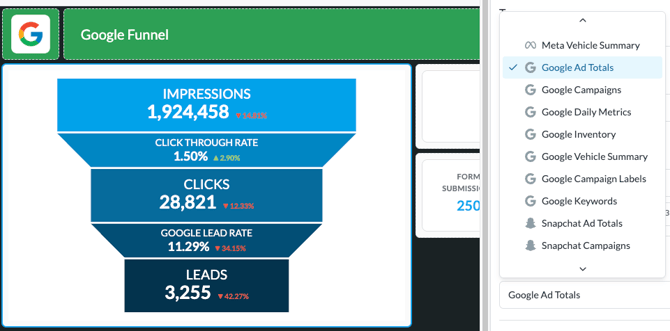
Data Source Guide:
- Ad Totals: Most used - things like Total Clicks, Total Impressions, Total Leads, etc.
- Campaigns: Includes campaign names and campaign-level metrics.
- Daily Metrics: Use this when creating trend reports or data, like Leads over time.
- Inventory: Specific VIN information; use this for things like “Top VINs by Clicks or Leads”
- Vehicle Summary: Total vehicle metrics, such as Total # of Advertised Vehicles, and Influenced Sales
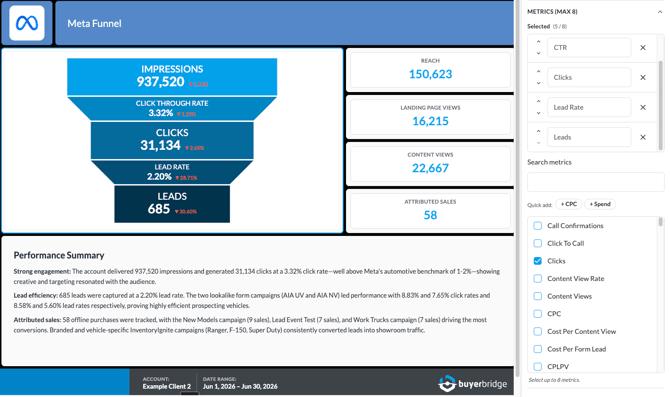
Metrics
Choose what the widget displays. Most widgets allow up to 8 metrics. (On a Table this section is labeled Columns; same idea: each one becomes a column.)
- Selected (x/8) - the metrics currently in the widget, shown as a reorderable list. Use the up/down arrows to change their order and the to remove one.
- Search metrics - find a metric by name.
- Quick add - one-click chips for common metrics (e.g., + Spend).
- Checkbox list - tick metrics to add them; the panel notes the max (e.g., "Select up to 8 metrics").
Widget-specific options
Some widget types add their own sections here. For example, a Funnel adds:
- Segment Shape - how the funnel segments are shaped.
- Side Metrics - attach a companion metric alongside each segment (e.g., show CPM next to Impressions, CPC next to Clicks).
Other widget types will show options relevant to them (axes, sorting, etc.). The principle is the same: configure the look/behavior specific to that visualization here.
Campaign filters
Narrow the data the widget includes.
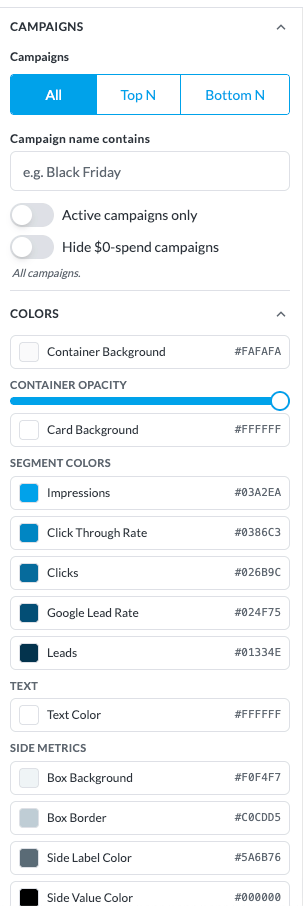
- All / Top N / Bottom N - show all campaigns, or just the top/bottom performers.
- Campaign name contains - filter to campaigns matching text (e.g., "Awareness").
- Active campaigns only - exclude paused campaigns.
- Hide $0-spend campaigns - exclude campaigns with no spend.
AI Insights
First, choose which pages and data points the AI engine should use to form its AI Insights. Then, choose your Summary Length (brief or detailed), and then add a prompt. For example, “Summarize the key trends from this data and compare to expected performance on Meta with no more than 30 words per bullet point and no more than 3
Bullets. Add a bolded title for each insight.” These will then dynamically update alongside the report metrics.
Colors
Style the widget to match your branding.
- Container Background and Container Opacity - the widget's outer card.
- Card Background - inner card color.
- Segment / Series Colors - a color per metric (e.g., Impressions, Clicks, Leads each get their own color).
- Text Color - widget text.
- Side Metrics colors (when applicable) - Box Background, Box Border, Side Label Color, Side Value Color.
Comparison
Controls period-over-period display (works with the report's Comparison toggle in the top bar).
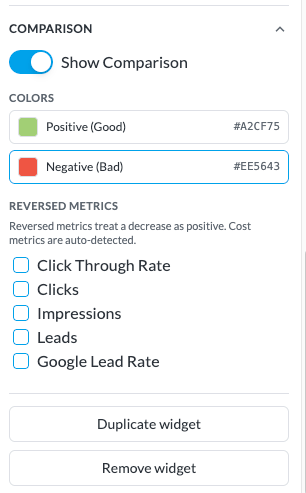
- Show Comparison - turn comparison on for this widget.
- Positive (Good) / Negative (Bad) colors - colors for favorable vs. unfavorable change.
- Reversed Metrics - for metrics where a decrease is good (most cost metrics), tick them here so the colors read correctly. Cost metrics are auto-detected, but you can override.
Duplicate / Remove
At the bottom: Duplicate widget and Remove widget.
6. Presenting and sharing reports
There are two ways to get a report in front of a client, depending on whether you're walking them through it live or sending something they can keep.
Option 1 - Present mode (best for live client calls)
Present mode is a full-screen, polished view of the report with animated charts and smooth page navigation, ideal when you're on a call walking a client through their performance.
To present:
- Open the report in Edit.
- Select the client account you want to present for (top-bar Account selector).
- Click Present in the top bar.
The report opens in the presentation experience for that account, with channel pruning applied (only the channels that client runs are shown).
Option 2 - Generate (download) or schedule a PDF report
When a client wants something to keep, or you want it delivered automatically, generate or schedule a PDF. From the Templates screen, open a report's menu, select a date range, and choose Generate Report (or use Scheduled Reports in the top toolbar).
Generate Report - produce a PDF now that you can download:
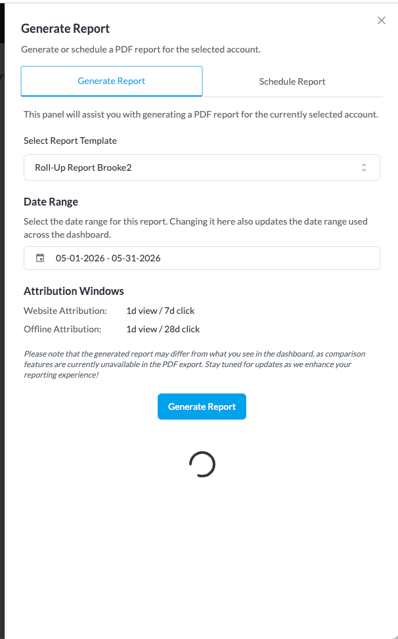
- Select Report Template - which report to generate.
- Date Range - the reporting period. Note: changing it here also updates the date range used across the dashboard.
- Attribution Windows - shown for reference (e.g., Website Attribution: 1d view / 7d click; Offline Attribution: 1d view / 28d click).
- Generate Report - produce the PDF for the selected account.
- Generate For All Accounts - produce the report for every account at once (an estimated time is shown, since this can take a while).
Schedule Report - set a report to generate and send automatically on a recurring basis:
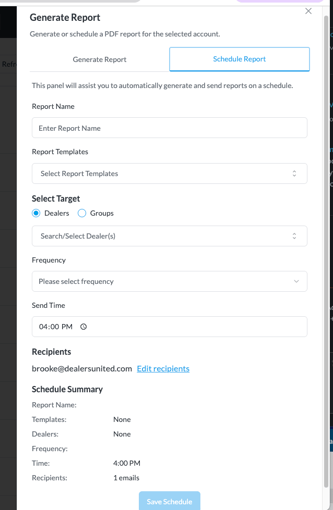
- Report Name - a name for the scheduled send.
- Report Templates - which report(s) to send.
- Select Target - choose clients or Groups, then search/select the specific client(s) or group(s) to send for.
- Frequency - how often it sends.
- Send Time - the time of day to deliver.
- Recipients - who receives it; use Edit recipients to change the list.
- Schedule Summary - a recap of the schedule you've configured.
- Save Schedule - activate the scheduled report.
Heads-up: comparison features are not currently available in the PDF export, so a generated report may differ slightly from what you see on the dashboard. This is noted in the panel and is being improved.
Tracking and re-downloading reports (My Reports)
Every report you generate is saved under My Reports, so you can watch it process, download a finished report again, or see whether one failed, all without regenerating it from scratch.
To open it, click My Reports in the top toolbar, next to Refresh and Scheduled Reports. When a new report enters the queue, a small blue dot appears on the My Reports button to let you know something is processing.

The My Reports panel lists your recent report generations, newest first. Each entry shows the report name, the account, and the date range, along with its current status:
- Queued: the report is still generating. It shows a spinner and updates automatically as it finishes.
- Download: the report is ready. Click Download to save the PDF again at any time, with no need to regenerate it.
- Failed: something went wrong during generation. An error message appears in red so you can see what happened, then you can try generating the report again.
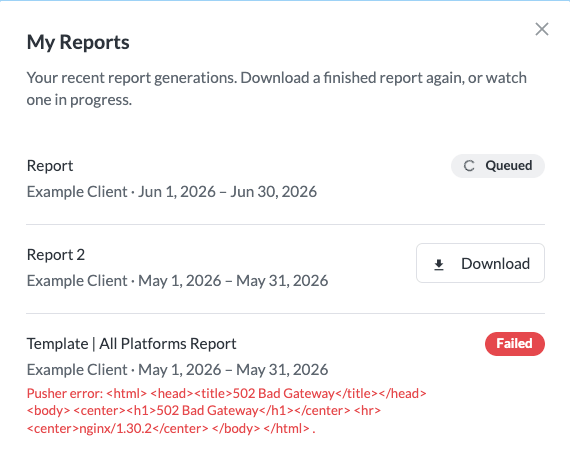
Tip: after you click Generate Report, you don't have to wait on the generate screen. Close it and check My Reports; the report will appear there as Queued and switch to a Download button once it's ready.
9. Tips and troubleshooting
- Use Duplicate Page to repeat a layout across channels instead of rebuilding it.
- Mark cost metrics as reversed in Comparison so a decrease shows as good.
- Check Widget gap and Padding settings for less or more white space around your elements.
- Build blended KPIs as Custom Metrics so cross-channel calculations are reusable in any widget.
- Build one template for all clients. Channel-aware pruning tailors each report automatically; no need for per-client versions.
- Present live, send PDFs. Use Present mode for client calls and Generate/Schedule a PDF for leave-behinds and recurring sends.