---
title: How to Use the Budgeting Tool
description: Track, pace, and adjust ad budgets across any channel in BuyerBridge. Set account and campaign goals, apply suggested daily budgets, and review spend and changes in one place.
---
[Skip to content](https://support.buyerbridge.com/knowledge/how-to-use-the-budgeting-tool#main-content)
English
Show submenu for translations
[Submit a ticket](https://support.buyerbridge.com/knowledge/kb-tickets/new?hsLang=en)
![BuyerBridge\_LOGO-dark-2.png\]](https://support.buyerbridge.com/hs-fs/hubfs/BuyerBridge_LOGO-dark-2.png?height=40&name=BuyerBridge_LOGO-dark-2.png)
Open main navigation
Close main navigation
- English
Show submenu for translations
- [Submit a ticket](https://support.buyerbridge.com/knowledge/kb-tickets/new)
- Go to buyerbridge.com
Go to buyerbridge.com
Welcome to the BuyerBridge Help Center!
- There are no suggestions because the search field is empty.
1. [Help Center](https://support.buyerbridge.com/knowledge?hsLang=en)
2. [Platform Tools](https://support.buyerbridge.com/knowledge/platform-tools?hsLang=en)
3. [Budgeting](https://support.buyerbridge.com/knowledge/platform-tools?hsLang=en#budgeting)
# How to Use the Budgeting Tool
## Track budgets, spot pacing issues, and apply suggested daily budgets across every account and channel, right inside BuyerBridge.
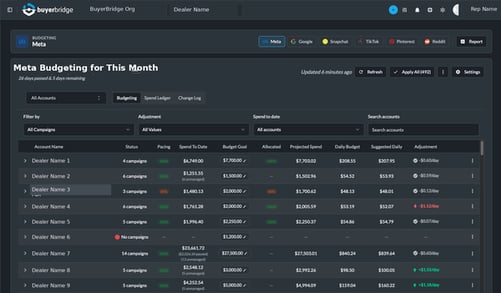
The Budgeting Tool gives you one place to manage ad spend across your accounts, on any channel. Set budget goals, see how each account is pacing, apply BuyerBridge's suggested daily budgets, and review spend history and changes, without spreadsheets or guesswork.
**Quick Links**
- [Where to Find the Budgeting Tool](https://support.buyerbridge.com/knowledge/how-to-use-the-budgeting-tool#where)
- [Select Your Channel and Run the Report](https://support.buyerbridge.com/knowledge/how-to-use-the-budgeting-tool#run)
- [The Three Views: Budgeting, Spend Ledger, Change Log](https://support.buyerbridge.com/knowledge/how-to-use-the-budgeting-tool#views)
- [Reading the Budgeting Columns](https://support.buyerbridge.com/knowledge/how-to-use-the-budgeting-tool#columns)
- [Understanding Pacing](https://support.buyerbridge.com/knowledge/how-to-use-the-budgeting-tool#pacing)
- [Setting Budget Goals](https://support.buyerbridge.com/knowledge/how-to-use-the-budgeting-tool#goals)
- [Applying Suggested Budgets](https://support.buyerbridge.com/knowledge/how-to-use-the-budgeting-tool#apply)
- [Spend Ledger and Change Log](https://support.buyerbridge.com/knowledge/how-to-use-the-budgeting-tool#ledger)
---
### **Where to Find the Budgeting Tool**
1. Log in to BuyerBridge.
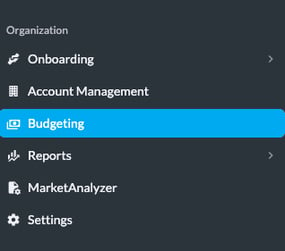
2. In the left menu, under **Organization**, click **Budgeting**.
---
### **Select Your Channel and Run the Report**
1. At the top, use the **channel buttons** (Meta, Google, Snapchat, TikTok, Pinterest, Reddit) to choose the channel you want to manage.
2. Choose an account scope from the **All Accounts** dropdown, or leave it on all.
3. Click **Run report**. It loads budgeting data for every account in the selected scope, which can take a moment depending on how many accounts you have.
4. Use **Refresh** anytime to pull the latest numbers.
The tool works the same across channels, so once you know the flow, it applies everywhere. Switch channels anytime with the buttons at the top.

#### **The Three Views**
The tool has three tabs:
- **Budgeting:** set goals, see pacing, and apply suggested daily budgets. This is the main view.
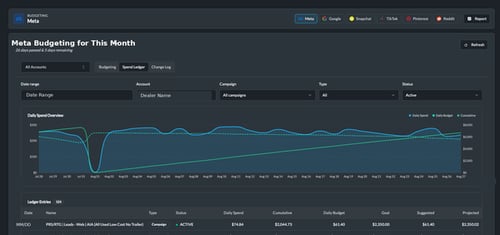
- **Spend Ledger:** daily spend history with a chart and per-campaign entries.
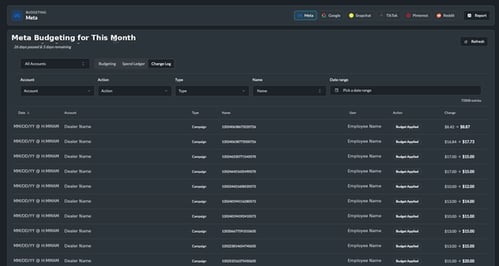
- **Change Log:** a record of every budget change applied, and by whom.
#### **Reading the Budgeting Columns**
In the Budgeting view, each account expands to show its campaigns. The columns are:
| Column | What it shows |
| --- | --- |
| **Account Name** | The account, expandable to its campaigns |
| **Status** | Number of active campaigns, or ACTIVE / PAUSED at the campaign level |
| **Pacing** | How the account is tracking against its budget, as a percentage |
| **Spend To Date** | Ad spend so far this month |
| **Budget Goal** | Your target spend, set at the account or campaign level (editable) |
| **Allocated** | How much of the account goal is assigned across campaigns |
| **Projected Spend** | Estimated month-end spend at the current pace |
| **Daily Budget** | What is set on the channel right now |
| **Suggested Daily** | The daily budget BuyerBridge recommends to hit the goal |
| **Adjustment** | The daily change needed, with a toggle to apply it |
The campaigns shown match the selected channel.
---
### **Understanding Pacing**
Pacing is how you catch problems before month-end. It compares spend so far against the budget goal and the days elapsed, and shows whether an account is on track.
- A pacing percentage near 100% means the account is on track.
- Well above 100% means it is spending too fast and will overshoot.
- Well below means it is underspending and will leave budget on the table.
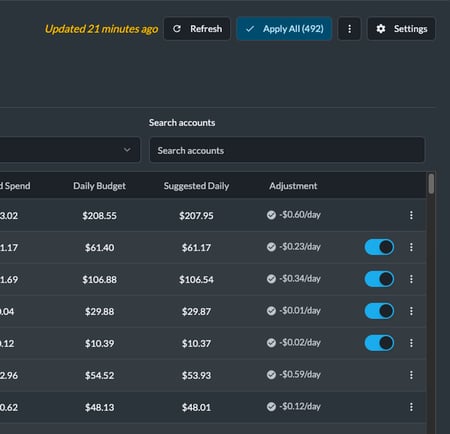
- The **Adjustment** column turns this into an action: a green up value means increase the daily budget, a red down value means decrease it, and the dollar amount is how much per day.
The header also shows the days passed and days remaining in the month, so you always know where you are in the cycle.
---
### **Setting Budget Goals**
You can set a goal for a whole account or a single campaign.
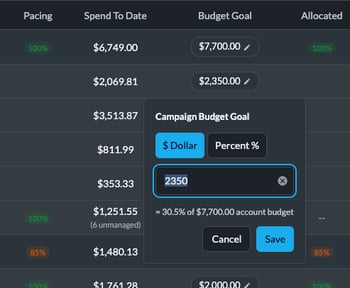
1. Click **Set goal** (or the pencil) in the Budget Goal column.
2. Choose **$ Dollar** to set a fixed amount, or **Percent %** to set a share of the account budget.
3. Enter the amount or percentage and click **Save**.
BuyerBridge recalculates the **Suggested Daily** and **Adjustment** right away.
---
### **Applying Suggested Budgets**
Once goals are set, you can push the suggested daily budgets to the channel.
- **One at a time:** use the toggle in the Adjustment column on a campaign row to apply its suggested daily budget.
- **All at once:** click **Apply All** at the top to apply every pending suggestion. The number in parentheses shows how many changes are queued.
- Use **Refresh** to confirm the changes took.
**💡 Note:** If some accounts show an error after applying, they usually need attention in the account itself (for example, a billing or access issue). Recheck those accounts directly.
---
### **Spend Ledger and Change Log**
**Spend Ledger** shows daily spend over a date range, with a Daily Spend Overview chart (daily spend, daily budget, and cumulative) and a table of per-campaign entries. Filter by date range, account, campaign, type, and status to dig into where spend went.
**Change Log** records every budget change: the date, account, campaign, who made it (including BuyerBridge System for automatic applies), and the before-and-after amount. Filter by account, action, type, name, and date range.
---
#### **Why It Matters**
- **Never over or underspend:** pacing and the adjustment column show which accounts need action today.
- **Move fast across accounts:** set goals, then Apply All instead of editing each channel account by account.
- **Stay accountable:** the Change Log gives you a full history of what changed and when.
**Pro tip:** Sort or filter by the Adjustment column to find the accounts drifting off pace, set or confirm their goals, then Apply All.
---
#### **Related Guides**
- [What Auto Pacing Does in Budgeting](https://support.buyerbridge.com/knowledge/what-auto-pacing-does-in-budgeting?hsLang=en)
- [How to Onboard Client Accounts to Any Channel](https://support.buyerbridge.com/knowledge/how-to-onboard-client-accounts-to-any-channel?hsLang=en)
- [Getting Started](https://support.buyerbridge.com/knowledge/getting-started?hsLang=en#main-content)
- [Welcome Kit](https://support.buyerbridge.com/knowledge/getting-started?hsLang=en#welcome-kit)
- [Getting Started](https://support.buyerbridge.com/knowledge/getting-started?hsLang=en#getting-started)
- [Navigating the Platform](https://support.buyerbridge.com/knowledge/getting-started?hsLang=en#navigating-the-platform)
- [Account Management](https://support.buyerbridge.com/knowledge/getting-started?hsLang=en#account-management)
- [Onboarding Clients](https://support.buyerbridge.com/knowledge/onboarding-clients?hsLang=en#main-content)
- [Channel Onboarding](https://support.buyerbridge.com/knowledge/onboarding-clients?hsLang=en#channel-onboarding)
- [Google Onboarding](https://support.buyerbridge.com/knowledge/onboarding-clients?hsLang=en#google-onboarding)
- [Meta Onboarding](https://support.buyerbridge.com/knowledge/onboarding-clients?hsLang=en#meta-onboarding)
- [Pinterest Onboarding](https://support.buyerbridge.com/knowledge/onboarding-clients?hsLang=en#pinterest-onboarding)
- [SEO Onboarding](https://support.buyerbridge.com/knowledge/onboarding-clients?hsLang=en#seo-onboarding)
- [Snapchat Onboarding](https://support.buyerbridge.com/knowledge/onboarding-clients?hsLang=en#snapchat-onboarding)
- [TikTok Onboarding](https://support.buyerbridge.com/knowledge/onboarding-clients?hsLang=en#tiktok-onboarding)
- [Platform Tools](https://support.buyerbridge.com/knowledge/platform-tools?hsLang=en#main-content)
- [Ad Builder](https://support.buyerbridge.com/knowledge/platform-tools?hsLang=en#ad-builder)
- [Ad Launcher](https://support.buyerbridge.com/knowledge/platform-tools?hsLang=en#ad-launcher)
- [Ads Library](https://support.buyerbridge.com/knowledge/platform-tools?hsLang=en#ads-library)
- [Best Practices](https://support.buyerbridge.com/knowledge/platform-tools?hsLang=en#best-practices)
- [Budgeting](https://support.buyerbridge.com/knowledge/platform-tools?hsLang=en#budgeting)
- [Campaign Management](https://support.buyerbridge.com/knowledge/platform-tools?hsLang=en#campaign-management)
- [EventFlow](https://support.buyerbridge.com/knowledge/platform-tools?hsLang=en#eventflow)
- [MarketAnalyzer](https://support.buyerbridge.com/knowledge/platform-tools?hsLang=en#marketanalyzer)
- [Playbooks](https://support.buyerbridge.com/knowledge/platform-tools?hsLang=en#playbooks)
- [SEOFlow](https://support.buyerbridge.com/knowledge/platform-tools?hsLang=en#seoflow)
- [Reports](https://support.buyerbridge.com/knowledge/platform-tools?hsLang=en#reports)
- [VINFlow](https://support.buyerbridge.com/knowledge/platform-tools?hsLang=en#vinflow)
- [White Labeling](https://support.buyerbridge.com/knowledge/platform-tools?hsLang=en#white-labeling)
- [Multichannel Advertising](https://support.buyerbridge.com/knowledge/multichannel-advertising?hsLang=en#main-content)
- [Overview](https://support.buyerbridge.com/knowledge/multichannel-advertising?hsLang=en#overview)
- [Google](https://support.buyerbridge.com/knowledge/multichannel-advertising?hsLang=en#google)
- [Meta](https://support.buyerbridge.com/knowledge/multichannel-advertising?hsLang=en#meta)
- [Pinterest](https://support.buyerbridge.com/knowledge/multichannel-advertising?hsLang=en#pinterest)
- [Snapchat](https://support.buyerbridge.com/knowledge/multichannel-advertising?hsLang=en#snapchat)
- [TikTok](https://support.buyerbridge.com/knowledge/multichannel-advertising?hsLang=en#tiktok)
- [Agency Sales Assets](https://support.buyerbridge.com/knowledge/agency-sales-assets?hsLang=en#main-content)
- [Facebook Sales Assets](https://support.buyerbridge.com/knowledge/agency-sales-assets?hsLang=en#facebook-sales-assets)
- [Google Sales Assets](https://support.buyerbridge.com/knowledge/agency-sales-assets?hsLang=en#google-sales-assets)
- [Graphics & Web Elements](https://support.buyerbridge.com/knowledge/agency-sales-assets?hsLang=en#graphics-web-elements)
- [Instagram Sales Assets](https://support.buyerbridge.com/knowledge/agency-sales-assets?hsLang=en#instagram-sales-assets)
- [Meta Sales Assets](https://support.buyerbridge.com/knowledge/agency-sales-assets?hsLang=en#meta-sales-assets)
- [Omnichannel Sales Assets](https://support.buyerbridge.com/knowledge/agency-sales-assets?hsLang=en#omnichannel-sales-assets)
- [Pinterest Sales Assets](https://support.buyerbridge.com/knowledge/agency-sales-assets?hsLang=en#pinterest-sales-assets)
- [Snapchat Sales Assets](https://support.buyerbridge.com/knowledge/agency-sales-assets?hsLang=en#snapchat-sales-assets)
- [TikTok Sales Assets](https://support.buyerbridge.com/knowledge/agency-sales-assets?hsLang=en#tiktok-sales-assets)
- [SEO for Dealers](https://support.buyerbridge.com/knowledge/agency-sales-assets?hsLang=en#seo-for-dealers)
- [Product Updates & Enhancements](https://support.buyerbridge.com/knowledge/product-updates-enhancements?hsLang=en#main-content)
- [Enhancements](https://support.buyerbridge.com/knowledge/product-updates-enhancements?hsLang=en#enhancements)
- [Product Updates](https://support.buyerbridge.com/knowledge/product-updates-enhancements?hsLang=en#product-updates)
- [Announcements](https://support.buyerbridge.com/knowledge/product-updates-enhancements?hsLang=en#announcements)
- [Monthly Updates](https://support.buyerbridge.com/knowledge/product-updates-enhancements?hsLang=en#monthly-updates)
- [Metrics](https://support.buyerbridge.com/knowledge/metrics?hsLang=en#main-content)
- [Offline Events](https://support.buyerbridge.com/knowledge/metrics?hsLang=en#offline-events)
- [Metrics Defined](https://support.buyerbridge.com/knowledge/metrics?hsLang=en#metrics-defined)
- [Leads](https://support.buyerbridge.com/knowledge/metrics?hsLang=en#leads)
- [Reporting](https://support.buyerbridge.com/knowledge/metrics?hsLang=en#reporting)
- [SEO Reporting](https://support.buyerbridge.com/knowledge/metrics?hsLang=en#seo-reporting)
- [Supported Providers](https://support.buyerbridge.com/knowledge/supported-providers?hsLang=en#main-content)
- [CRM Integrations](https://support.buyerbridge.com/knowledge/supported-providers?hsLang=en#crm-integrations)
- [Inventory & Feed Providers](https://support.buyerbridge.com/knowledge/supported-providers?hsLang=en#inventory-feed-providers)
- [Website Providers](https://support.buyerbridge.com/knowledge/supported-providers?hsLang=en#website-providers)
- [3rd Party Support](https://support.buyerbridge.com/knowledge/3rd-party-support?hsLang=en#main-content)
- [Google Help Center](https://support.buyerbridge.com/knowledge/3rd-party-support?hsLang=en#google-help-center)
- [Facebook Platform Help](https://support.buyerbridge.com/knowledge/3rd-party-support?hsLang=en#facebook-platform-help)
- [TikTok Help Center](https://support.buyerbridge.com/knowledge/3rd-party-support?hsLang=en#tiktok-help-center)
[](https://buyerbridge.com/)
buyerbridge.com | Help Center
Copyright © 2026, Dealers United