The BuyerBridge team has been working behind-the-scenes to replace the old dashboard with a more data-intensive version because we felt the previous dash wasn't as strong of an introduction to the BuyerBridge platform as it could be.
While this may seem like a smaller update, it is important because the new dashboard will become the new “homepage,” so we want to prepare you for the change!
With this update, all end users (both clients and agencies) will have the same experience, see the same data, and have a better first impression of the platform—and your results.
Use the quick-links below to jump to:
- Onboarding Account Experience
- Live Account Experience
- [UPDATE] Global Reporting Filters and Attribution Windows
Detailing the New Dealer Dashboard
Onboarding Account Experience
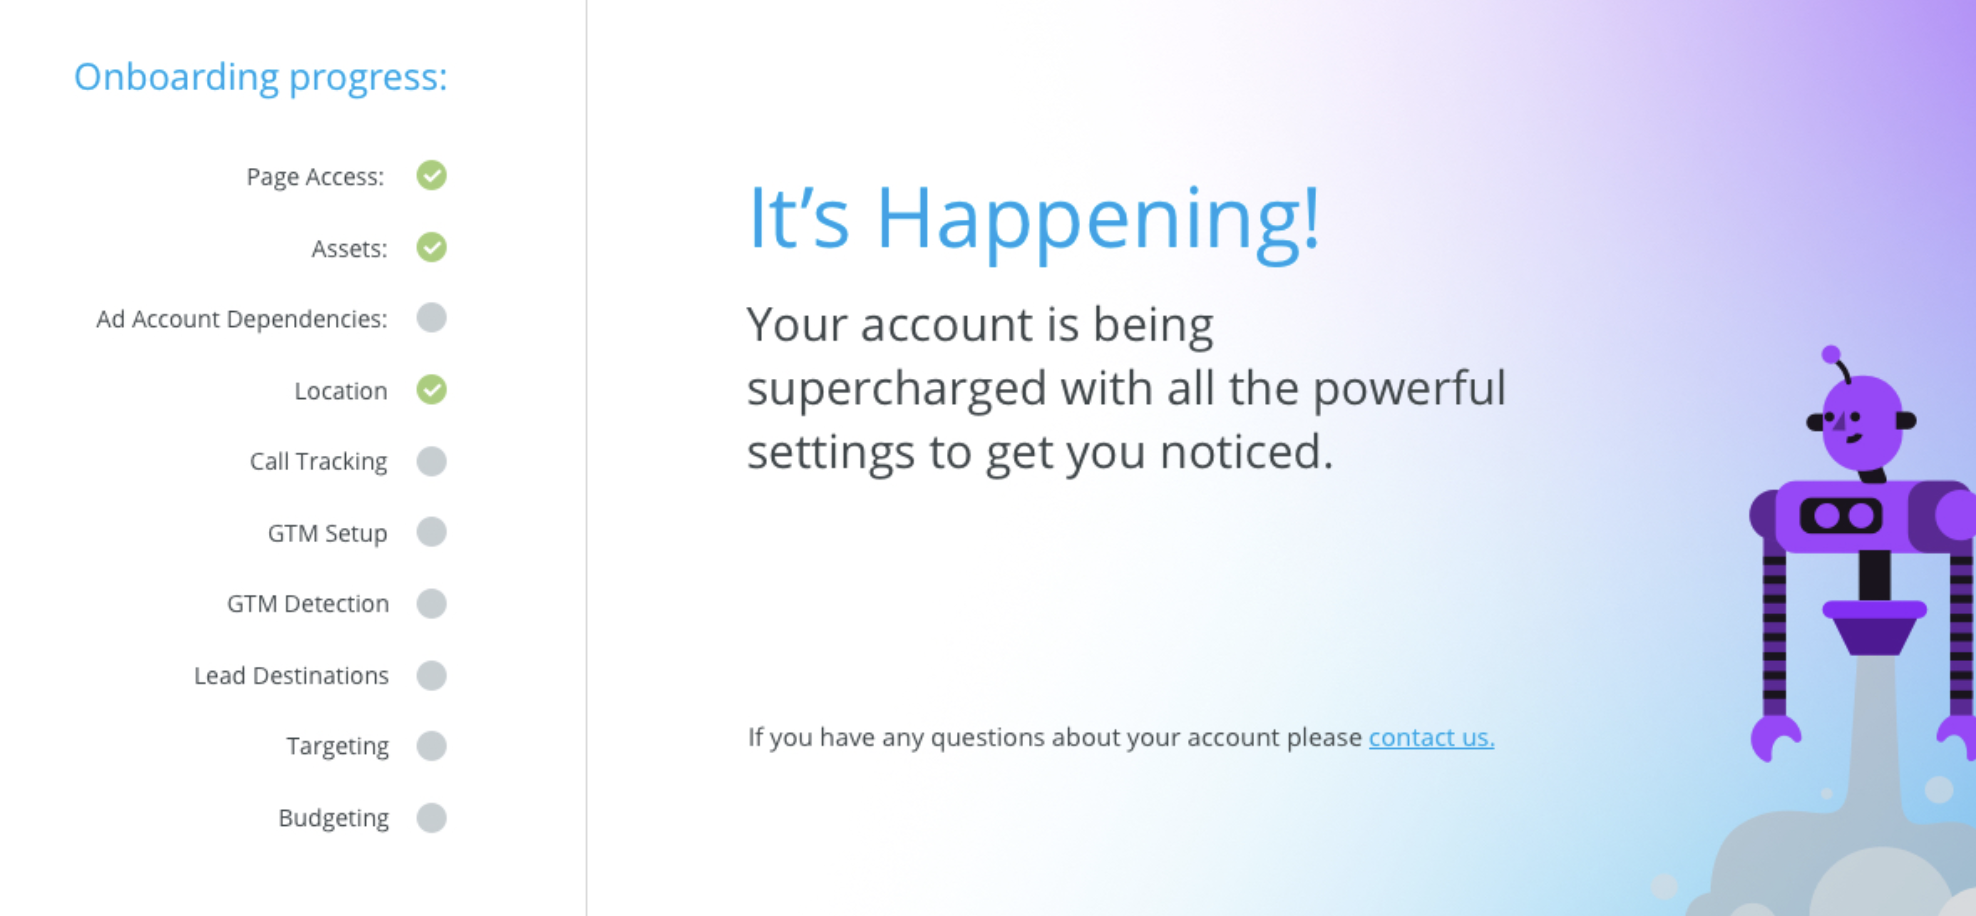
If you’re currently onboarding a dealer account, the Dealer Dash will now be a different experience for your "client" (e.g. dealer user).
Instead of logging in and seeing an empty Dealer Dash as before, newly Onboarded accounts will see an alternate view with each step of their Onboarding and progress indicators!
Live Account Experience
For existing dealer accounts, the dashboard is jam-packed with important data and contains 4 main parts:
- Metric Funnel
- Budget Pacing
- Facebook Marketplace Stats
- Facebook Ad Stats
The stats that are generated in the Dealer Dash will be automatically based on the last 30 days, and compared to the 30 days before that.
To change the date range, find “Select Dates:” at the top of the dashboard and set the new range.
The original Dealer Dashboard is a heavily redacted version in comparison to our new version, but users can still access the previous version of the dash and settings:
Navigate to the top right corner of the dash > click the “Dealer Info” icon.

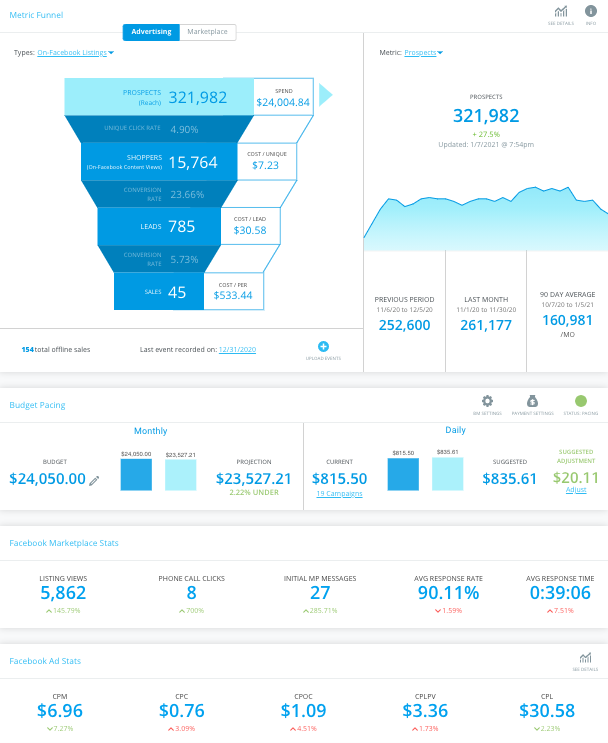
1. Metric Funnel
BuyerBridge has created 3 specific Metric Funnels to help users running one of our “Advertising” products evaluate their different types of campaigns & ads on Facebook: a Default Funnel, All Traffic Funnel, and On-Facebook Listings Funnel.
The Metric Funnel will automatically display the Default Funnel, but changing Funnel Types is easy. To the left of the Tunnel, find “Types:” > toggle from Default to either All Traffic or On-Facebook, depending on what you want the funnel to reflect.
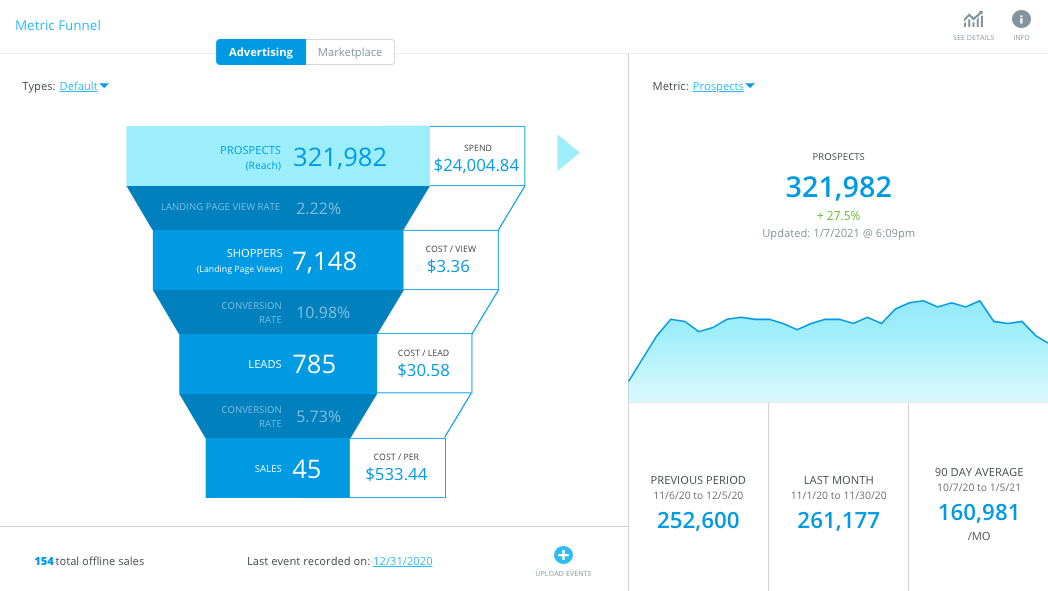
- Key Stats: Prospects (Reach), Landing Page View Rate, Shoppers (Landing Page Views), Conversion Rate, Leads, Sales - if offline events have been uploaded, plus SO many more.
- Tip: To generate data from a specific metrics previous period, last month, and get a 90 day average: Find “Metric:” > toggle to the type of metric you wish to view.
- Click “See Details” to access the full Facebook Advertising and Marketplace Report from inside the dealer dash.
For users running one of our “Marketplace” products, there is only one type of Metric Funnel that will display.
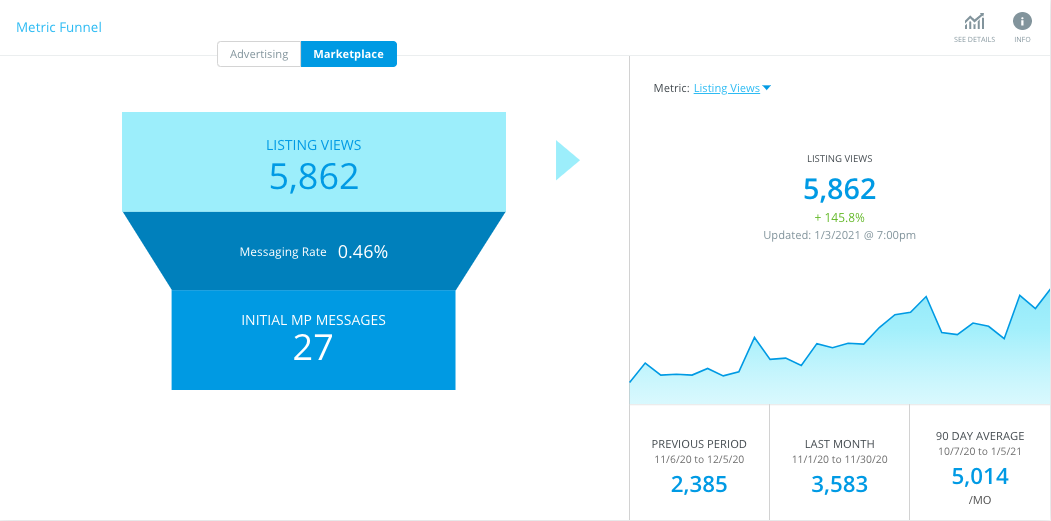
- Key stats: Listing Views, Messaging Rate, and Initial MP Messages.
- Tip: To generate data from a specific metrics previous period, last month, and get a 90 day average: Find “Metric:” > toggle to the type of metric you wish to view.
Want more information on Facebook Funnel Types? In the Dealer Dashboard, click the “Info” icon located in the top right corner of the Metric Funnel section.
2. Budget Pacing
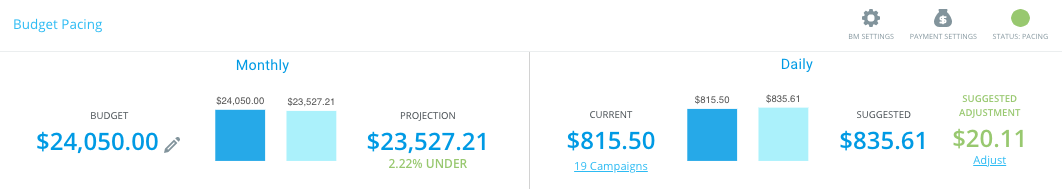
The Budget Pacing section includes the set Monthly Budget & Projection, along with the current Daily Budget & Suggested Adjustments.
NOTE: Budget Pacing is read-only and cannot be adjusted by dealer users!
You’ll notice we placed three icons located in the upper right corner of Budget Pacing.
- If you are looking to access your Business Manager directly from BuyerBridge, simply click the “BM Settings” icon. ⚙️
- To drop into your Facebook Ads Manager Payment Settings from the interface, click the “Payment Settings” icon. 💰
- Easily identify whether or not your current budget is within thresholds to meet the target monthly budget by checking out the “Status:” icon. 🟢
3. Facebook Marketplace Stats
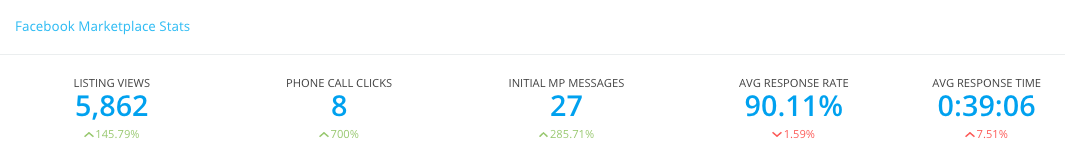
If a dealer has Marketplace listings, they will see the following Facebook Marketplace Stats:
- Key Stats: Listing Views, Phone Call Clicks, Initial MP Messages, AVG Response Rate, AVG Response Time
Below each metric will be a % that is either in green or red and indicates the performance of that specific stat for the dates you’ve selected in comparison to the previous 30 days.
4. Facebook Ad Stats
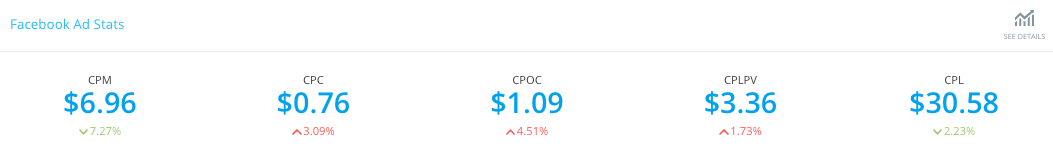
Dealer users who are running one of our “Advertising” products will see:
- Key Stats: Cost Per Mille, Cost Per Click, Cost Per Outbound Click, Cost Per Landing Page View, and Cost Per Lead.
- Tip: Click “See Details” to access the full Facebook Advertising Report from inside the dealer dash.
Below each metric will be a % that is either in green or red and indicates the performance of that specific stat for the dates you’ve selected in comparison to the previous 30 days.
[UPDATE] Global Reporting Filters and Attribution Windows:
We've added the capability for users to further filter the data displayed on the Dealer Dashboard, and Dealer Reports like Facebook Advertising and Facebook Marketplace!
For key affected reports, there will now be a new toolbar (see image below) located at the top of the screen!
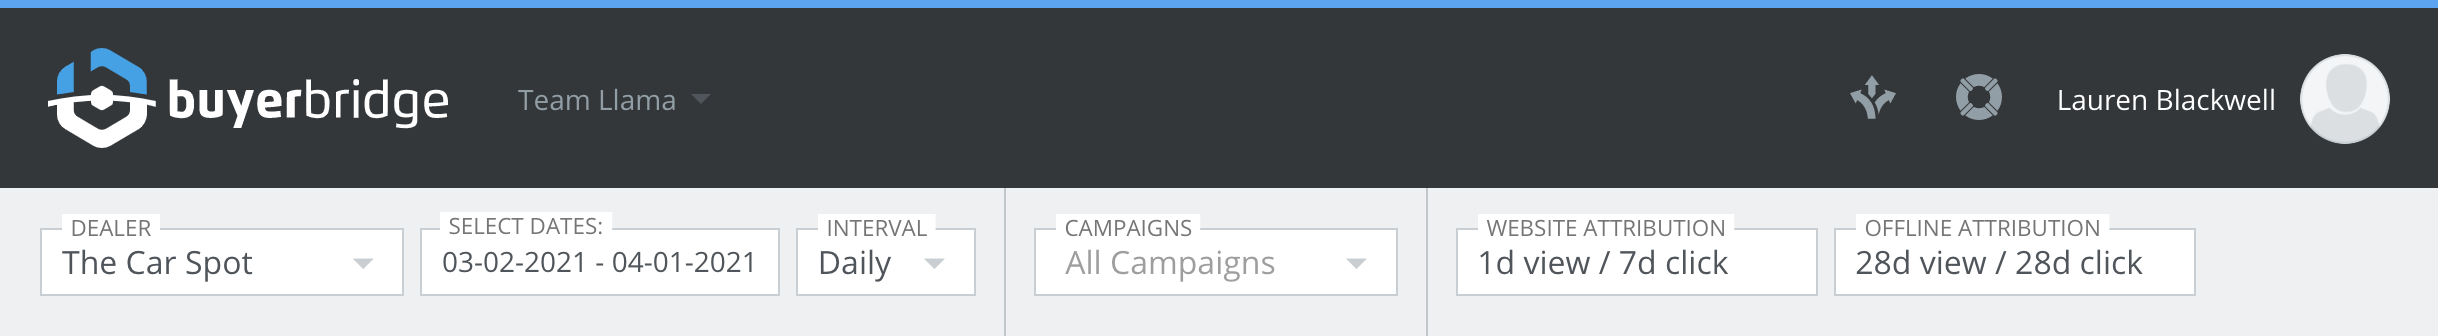
Our new toolbar allows users to control the following filters globally:
- Interval: Users now have the ability to control the intervals for which data is displayed. You can drop down the Intervals tab and toggle between "Daily," "Weekly," "Monthly," and "Quarterly" intervals.
- Campaigns: Previously, we limited the data displayed throughout Dealer Reports to "All Campaigns..." but with this update, Campaign selections are available across all reports and are cached - meaning the selected filters will be maintained throughout the pages you're navigating.
- Attribution Window: You will now be able to filter Dealer Reports to display data specific to the Website Attribution and Offline Attribution window: You can personalize reports to display data using on 1 Day View and 1 Day or 7 Days Click (for Website Attribution), and 1 Day, 7 Days, or 28 Days View and 1 Day, 7 Days, or 28 Days Click (for Offline Attribution).
- For example: If you want to view data relating to a 28 Days view and 7 Days click or 7 Days View and 7 Days Click for Offline Attribution, you can!
- Plus, the data will dynamically change based on the filter - without requiring users to refresh the page.
- Key stats now show the attribution matrix where applicable and the Offline events matrix will sync up with the selected window.
- Attribution window changes do not require reloading. You will see those changes happening live!
NOTE: This update affects Dealer Reports ONLY! We will be revisiting Reseller reports in the near future!