BuyerBridge has developed our PDF Report Builder Tool to provide you with a way to automatically generate and download personalized social media ad reports for your clients!
The BuyerBridge Report Builder allows you to customize, brand, and deliver downloadable social media ad reports for any client's active advertising channels!
Social media ad reports can be built for Facebook, Snapchat, TikTok, & Pinterest!

In this article, we will walk through the following:
- How To Access The Report Builder
- How To Customize Your Social Media Ads Report Template
- How To Use Your Report Templates
- Try it! Build A Snapchat Report
How To Access The Report Builder & Create A New Report Template
To locate the BuyerBridge Report Builder and start building Report Templates:
- Go to the BuyerBridge navigation menu, under Organization > locate Reports > click Report Builder
This will drop you into the Report Templates page, which is one central location for ALL Report Templates created by users within your organization.
From the Report Templates page, users will be able to "Add New" Report Templates, "Delete," "Preview," or "Generate PDF" Reports at any time!
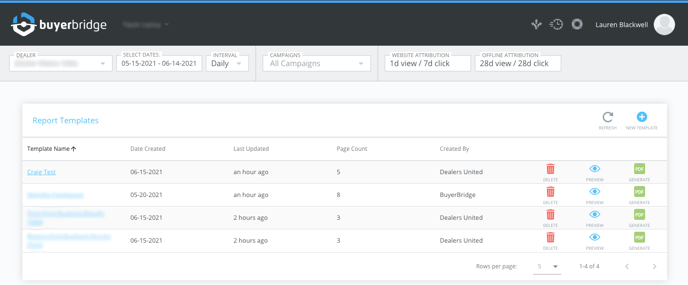
Our Report Templates page by default includes a "Monthly Facebook” Report base template that you can view and download - but the base template is not customizable.
- From the header menu inside of BuyerBridge, select the Account Name and Date Range you want to use for generating the Report Template (you can also use the Account drop-down to scroll and find any client's Account).
- Click the “New Template” (+ Icon) located in the upper right corner of the Report Templates Page.
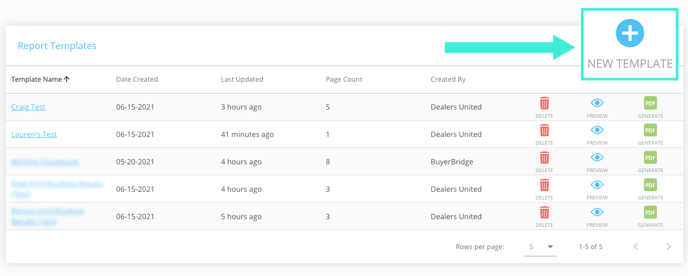
- Name your new template > click Next.
Keep in mind that this is what your template will be referenced by and what will be displayed as the title of the report upon generation.
After clicking next, the PDF Report building tool will be displayed, which is where you will be able to customize your report!
How To Customize Your Social Media Ads Report Template
Your Report Template can be customized in a ton of ways, but the first step is to Add Pages.
- To add Pages to your PDF Report: click Add Pages on the left side of the screen.
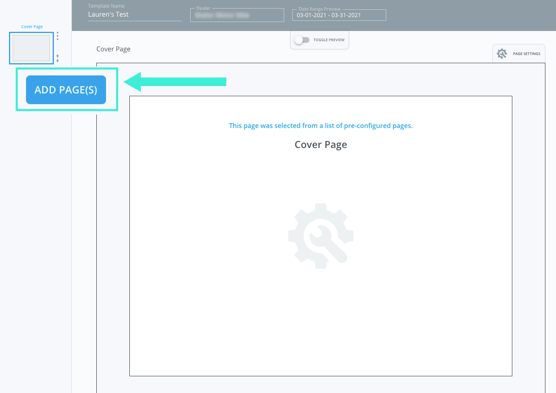
This will prompt the Pages slideout panel to display, where you will be able to add both Pre-Configured Pages and Custom Pages.
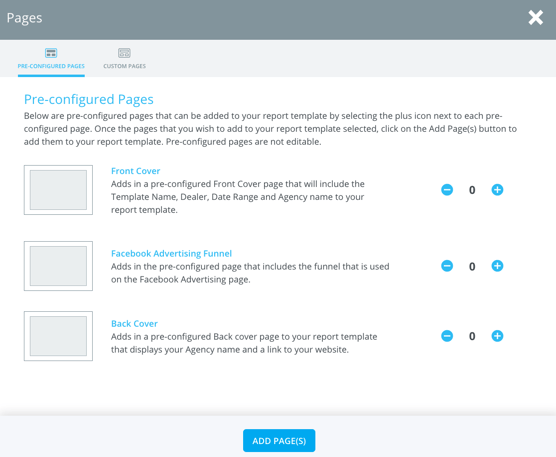
There are 3 Pre-Configured Pages that can be included in the report: Front Cover, Facebook Advertising Funnel, and Back-Cover.
And there are also 4 types of Custom Pages: Full Page, 2 up Horizontal, 3 up (1 top, 2 bottoms), and 3 up (2 top, 1 bottom).
To add Custom Pages:
- Toggle from Pre-Configured Pages to Custom Pages > click the “+” icon next to the desired design layout(s) > click Add Page(s).
Next, it's time to personalize the report with Page Title, Platform, Product, and Content-type is simple:
- Click Page Settings located above the Page you wish to customize.
Page Settings allows users to rename the Page Title, choose the Platform and Product being used for the report, and Content within the page.
You can change the Page Title at any time, pick the Platform you want to base the Report page on (Facebook, Snapchat, TikTok, Pinterest), and personalize the type of content/metrics included.
- Once you have decided which pages you want to include, fill each Region of the page with any of the following options:
- Funnel
- Billboard
- Graph
- Table
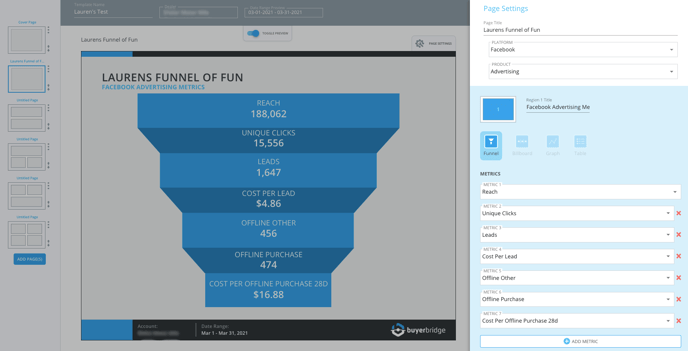
- To insert a Funnel to a region of the Page:
- Click Funnel
- Select a Metric from the Metrics dropdown
- There are dozens of different metric options available, from Click to Call to Offline Purchase.
- Click Add Metric and continue selecting metrics from the Metrics drop down until you have reached the minimum Metrics (7) or maximum (8)!
Users can easily remove or replace any of the selected Metrics, click the red “X” located to the right of the specific Metric.
- To add a Billboard, Graph, or Table to any region of your PDF Report:
- Select the widget you want to add (1 metric is required to use the Billboard, Graph, or Table widgets).
If you choose to use a Table in your custom PDF Report, be aware: This widget size is limited to displaying only 5 rows. When using a Table for the report, users will have the ability to choose the Data Type that is displayed, and how it is sorted in the report itself.
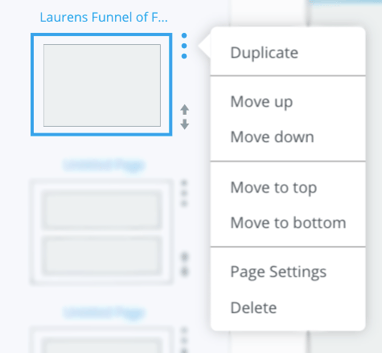
At any time throughout Report Template customization, users can click the 3 dots located to the right of the specific Page to perform the following functions: Duplicate, Move up, Move down, Move to top, Move to bottom, access Page Settings, or Delete the page.
Once you have finished creating your custom PDF Report Template:
- Click Save & Exit in the upper right-hand corner of the customization screen
Your template will be saved in the Report Templates area of BuyerBridge!
How To Use Your Report Templates
As previously mentioned, you can locate all of your Report Templates at any time from the Report Templates page, located under Organization > Reports > Report Builder.
To generate a PDF Report for a specific Account:
- Click the PDF icon
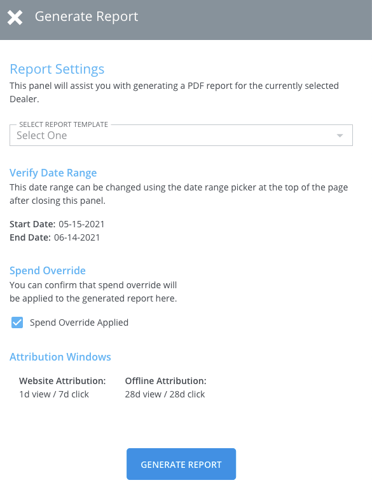
- Use the “Select Report Template” dropdown to select which Report Template you want to generate a report using
- Click Generate Report and BuyerBridge will create your custom PDF Report!
Try it! Build A Snapchat Report
- Create a New Report Template
- Add a Custom Page (“3 up, 1 top, 2 bottom”)
- Region 1 “Graph”(Impressions, Swipes)
-png-1.png?width=358&name=unnamed%20(6)-png-1.png)
- Region 2 “Funnel” (Impressions, Swipes, Leads)
-png-1.png?width=375&name=unnamed%20(7)-png-1.png)
- Region 3 “Billboard” (Spend, CPM, Cost/Swipe, Swipe Rate, CPL)
-png-1.png?width=383&name=unnamed%20(8)-png-1.png)
- Preview and Save!
-png-1.png)