What this report is (and why teams love it)
The Google Vehicle Advertising Report is an automotive-specific view that ties Google ad performance to individual vehicles. Instead of guessing what’s working, you can scan performance by VIN, filter by make/model/trim, and use the Influenced toggle to highlight sales your ads helped drive.
Reporting data comes from your connected Google properties, including Google Ads for delivery metrics (spend, impressions, clicks, CPC, CTR, leads). The Influenced view is powered by a sales/influenced-sale signal tracked via an API connection.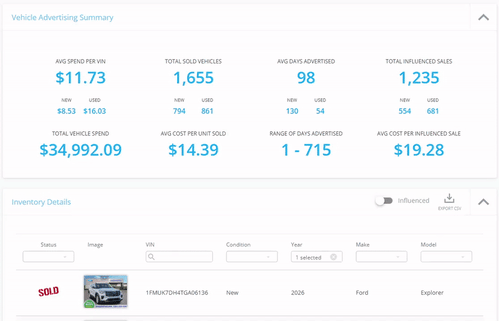
Quick Links
Where to Find the Google Vehicle Advertising Report
-
Log in to BuyerBridge.
-
In the left navigation, go to Channels > Google > Vehicle Advertising (report page).
-
Set your date range at the top of the report.
How to Use the “Influenced” Toggle (and How It Works)
The Influenced toggle in BuyerBridge makes it easy to prove your ads are driving real results, not just leads or clicks. Here’s how to use it—and what’s happening behind the scenes:
How to Toggle “Influenced” On and Off
-
Go to the Vehicle Advertising report in BuyerBridge.
-
Find the Influenced toggle at the top of the report.

-
Switch it ON to highlight vehicles where your Google ads influenced a sale.
-
Switch it OFF to view standard performance for all inventory.
How BuyerBridge Measures “Influenced” Sales
A sale is considered influenced if:
✅ The vehicle (VIN) had Google ad spend,
✅It received at least one click engagement,
✅ And it was later marked as sold.
If all three are true, BuyerBridge credits your Google ads with influencing that sale. This is especially useful for dealers who don’t upload full “sold” reports, and as platforms like Facebook make offline attribution more challenging.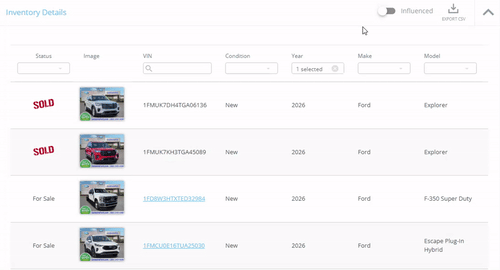
Why this matters:
The Influenced feature shows clients the true impact of your ads even if you don’t have full matchback data from the dealership.
Pro tip: Use the Influenced view in client meetings to quickly spotlight which vehicles were moved with help from your campaigns.
Vehicle Advertising Summary (Unpacking the Top KPIs)
This section gives you a fast snapshot of performance and sales impact for the selected date range.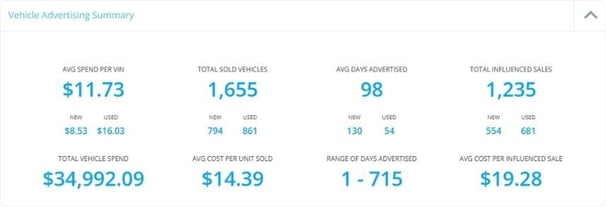
| Avg Spend Per VIN | Average ad spend per vehicle. Often shown with New and Used breakouts. |
| Total Vehicle Spend | Total Google ad spend across the vehicles included in the report. |
| Total Sold Vehicles | Total count of vehicles marked sold (typically shown with New and Used breakouts). |
| Avg Days Advertised | Average number of days vehicles were advertised during the selected range (often split by New vs Used). |
| Range of Days Advertised | Lowest-to-highest advertising duration across vehicles (helps spot “aged” inventory exposure). |
| Total Influenced Sales | Number of sales flagged as influenced when the Influenced toggle is enabled (often split New vs Used). |
| Avg Cost Per Unit Sold | Average cost to sell a vehicle based on spend and sold vehicles. |
| Avg Cost Per Influenced Sale | Average cost per influenced sale based on spend and influenced sales. |
Inventory Details (Rows, Filters, and What You’re Seeing)
The Inventory Details table is where the report gets tactical. Each row represents a single vehicle (VIN) and includes inventory attributes plus Google performance metrics.
How to use the table fast:
-
Filter by Status to isolate For Sale vs Sold
-
Filter by Condition (New, Used, CPO)
-
Filter by Year / Make / Model / Trim to compare like-to-like inventory
-
Use the VIN column to pull up one specific vehicle quickly
-
Sort by performance metrics like Spend, Clicks, CTR, Leads, or CPL to find winners and problems fast
Column Glossary (Google Vehicle Advertising Report)
Use this glossary to understand what each column means in the Inventory Details table.
Vehicle and Inventory Columns
| Status | Whether the vehicle is currently For Sale or Sold. |
| Image | Vehicle thumbnail for quick visual identification. |
| VIN | Unique vehicle identifier. Best for searching one specific unit. |
| Condition | Vehicle condition: New, Used, or CPO. |
| Year (select) | Vehicle year. Filterable. |
| Make (select) | Vehicle make. Filterable. |
| Model (select) | Vehicle model. Filterable. |
| Trim (select) | Vehicle trim. Filterable. |
| Price | Listed vehicle price (as available from the inventory feed/source). |
Google Performance Columns
| Spend | Total Google ad spend attributed to that VIN for the selected date range. |
| Impressions | Number of times ads for that VIN were shown. |
| CPM | Cost per 1,000 impressions. |
| Clicks | Total clicks for that VIN. |
| CPC | Cost per click. |
| CTR | Click-through rate (clicks divided by impressions). |
| Leads | Total leads attributed to that VIN (based on your tracking setup). |
| CPL (cost per lead) | Cost per lead (spend divided by leads). |
Time-in-Inventory Columns
| Days in Lot | How many days the vehicle has been on the dealer’s lot. |
| Days in BuyerBridge | How long this vehicle has been synced with the BuyerBridge app. |
How to Use This Report (Real Agency Workflows)
1) Prove performance to clients without guessing
-
Turn Influenced ON to highlight influenced sales.
-
Use the Summary KPIs to tell the story quickly (spend, influenced sales, cost per influenced sale).
-
Filter by Make/Model/Trim if the client wants to see performance by vehicle type.
2) Find waste fast
-
Sort by Spend and scan for vehicles with high spend and low clicks/leads.
-
Use CTR to spot creative or offer issues.
-
Use CPL to identify which vehicles are expensive to convert.
3) Prioritize aged inventory
-
Sort/filter by Days in Lot to isolate vehicles that are aging.
-
Cross-check with Spend, CTR, Leads to decide if you need new creative, pricing changes, or budget shifts.
4) Spot inventory sync issues
-
If performance looks off for a vehicle, check Days in BuyerBridge.
-
A very low number can indicate the vehicle was recently added or recently synced, which can explain limited data.
Troubleshooting Tips
-
Not seeing the vehicles you expect: Confirm your date range and Campaigns filter.
-
Influenced toggle shows limited data: Influenced sales require the necessary sales signal via API tracking. If it’s not configured for that account, you may only see standard performance metrics.
-
Leads look low or missing: Confirm conversion tracking and account setup for that client.
Keep Learning (Recommended Next Articles)